20050624 Daily chart emini NQ. Chart shows shamu short pattern in progress. Targets the next support area 1594, the 34 ema.

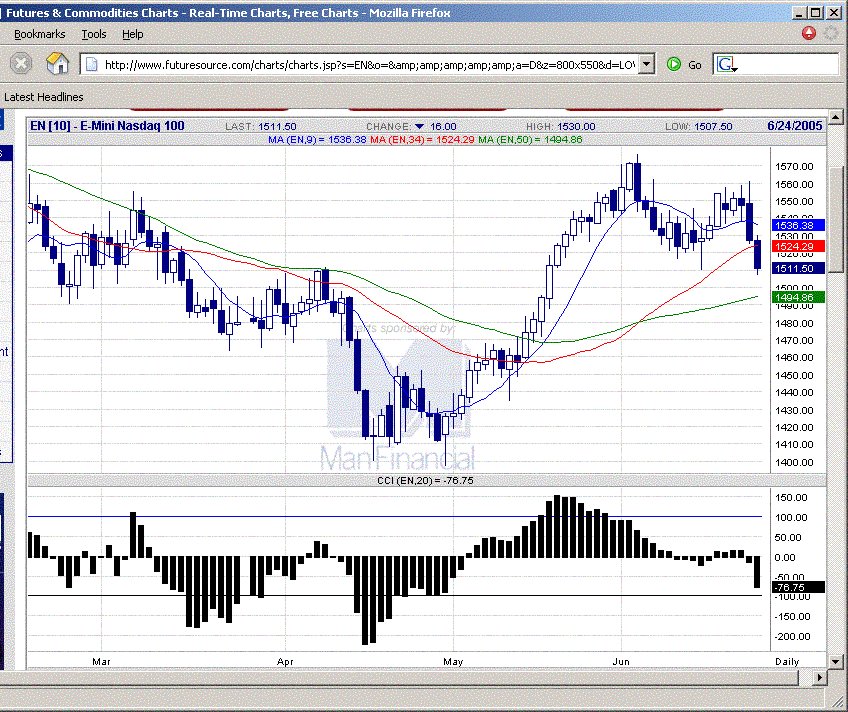 NQ daily chart
posted by emacro @ 9:55 PM
0 comments
![]()
![]()
Cronicle of trading in NQ 30 min breakout system, popularised by A Zuckerman of Realitytrader.com, WoodiesCCIClub patterns provide entries. Charts generated by Medved Quotetracker (www.quotetracker.com) Disclaimer: Nothing on this page constituutes advice to buy or sell financial instruments. The contents are for educational purposes only and are a personal journal.
20050624 Daily chart emini NQ. Chart shows shamu short pattern in progress. Targets the next support area 1594, the 34 ema.
NQ daily chart
posted by emacro @ 9:55 PM
0 comments
![]()
![]()
20050624 Op 30 min range 1522-1529, 7 NQ points. With range less than 10-12 NQ points and mov avg above the range, the short on the breakout of this range on downside was the trade to take (arrow). Went on to close near low of the day.
 NQ daily chart
posted by emacro @ 9:51 PM
0 comments
![]()
![]()
20050624
posted by emacro @ 8:32 AM
0 comments
![]()
![]()
20050623 The op range was 1544.5-1554.5 10 NQ points, so the decision was to go counter to a break of this range. Two nice traces resulted.
 NQ daily chart
posted by emacro @ 7:50 PM
0 comments
![]()
![]()
20050623
posted by emacro @ 9:25 AM
0 comments
![]()
![]()
20050622 Op 30 min range 1548 to 1554.5. Short was indicated when broke down 1548. But requires a judgment call as the mov avg were in the way.
 NQ daily chart
posted by emacro @ 7:39 PM
0 comments
![]()
![]()
20050622
posted by emacro @ 9:35 AM
0 comments
![]()
![]()
20050621 Op range 30 min was 1542-52 10 NQ points. Counter trend signal taken at the bar shown by the arrow. Bar had no tail indicating buying interest.
 NQ daily chart
posted by emacro @ 11:13 AM
1 comments
![]()
![]()
20 ema 15 min=1548.50 30 min=1547.50 60 min=1547.50
posted by emacro @ 9:11 AM
0 comments
![]()
![]()
20050617 Trade was hot of break of bottom of 30 min range around 1540, which is below the 20 ems, went to 1537 about 3 NQ pts, not enough to reach target minimum o .1.5X 30 min range, no follow through.
 NQ daily chart
posted by emacro @ 11:39 AM
0 comments
![]()
![]()
20 ema 15 min=1548 30 min=1548 60 min=1546
posted by emacro @ 9:01 AM
0 comments
![]()
![]()
20050617 Daily pttern shows ZLR CCI buy pattern. The trigger was actually on the Thursday of the week one day before the gap up candle on Friday. A good target would to look for move back to previous high above 1673.
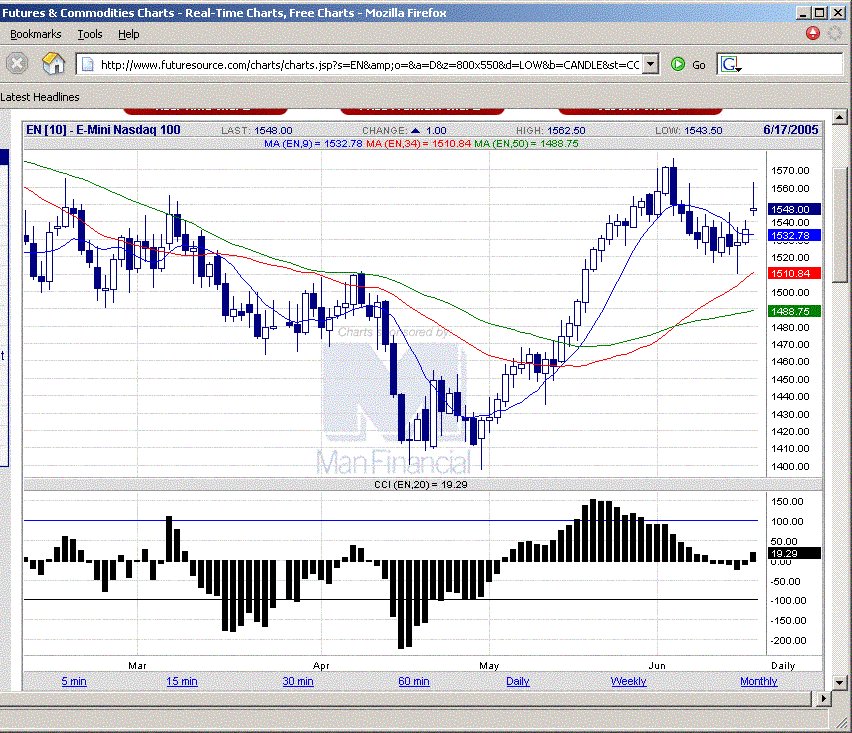 NQ daily chart
posted by emacro @ 6:50 AM
0 comments
![]()
![]()


