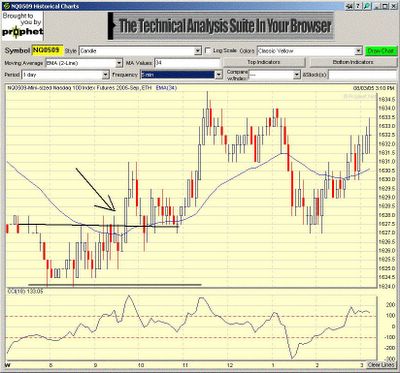
1) EMA levels 1617.50 1620 1621.50 2) Consolidatin trade into previous day's close 3) Opening 30 min range 1612-1620. Trade was short the break out on the downside, but momentum was muted, neither T1 or T2 hit, with small profit.
NQ daily chart
Cronicle of trading in NQ 30 min breakout system, popularised by A Zuckerman of Realitytrader.com, WoodiesCCIClub patterns provide entries. Charts generated by Medved Quotetracker (www.quotetracker.com) Disclaimer: Nothing on this page constituutes advice to buy or sell financial instruments. The contents are for educational purposes only and are a personal journal.
1) EMA levels 1617.50 1620 1621.50 2) Consolidatin trade into previous day's close 3) Opening 30 min range 1612-1620. Trade was short the break out on the downside, but momentum was muted, neither T1 or T2 hit, with small profit.
1) EMA levels 1630.50 1629.50 1627.50 2) Strong close trade the previous day closing 3) Opening 30 min range 1622.50-1626.50. Trade was to short breakout on downside First trade stopped out, 2nd reentry short T1 and T2 hit.
1) EMA levels 1628 1624.50 1621 2) Consolidation trade the day before 3) Opening 30 min range 1624-1627. Trade was to long the breakout to the upside. T1 and T2 hit.
20050802 1) EMA levels 1617 1616.50 1616 2) Stong closing trade the previous day 3) Opening 30 min range 1615.50-1622. Trade was to long the breakout on the upside with T1 and T2 met.
20050801 1) EMA values 1616.50 1617.50 1617.50 2) Consolidation trade the previous day 3) Opening 30 min range 1614.5-1619.5. Trade was short the breakout on the downside, but folow through limited targets not reached.