Friday, October 07, 2005

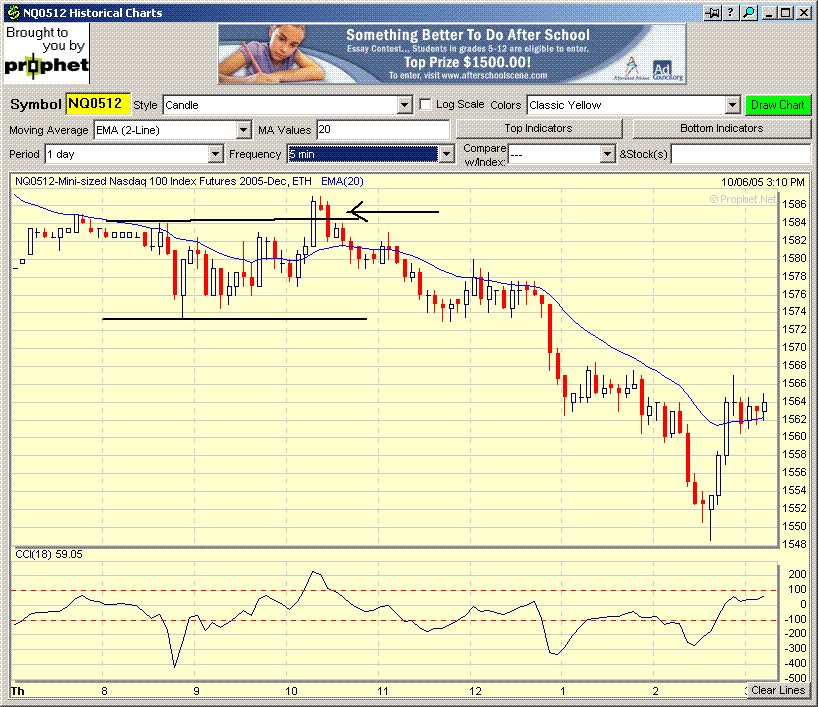
20051007 1) EMA levels 1568.50 1575 1575.50 2) Consolidation trade into previous day close 3) Opening 30 min range 1566-1572.50. Trade was to short the breakout to the downside of the opening 30 min range. Posted by Picasa

NQ daily chart

20051007 Daily chart. Posted by Picasa

NQ daily chart

20051006 1) EMA levels 1593.50 1597 1601 2) Strong trade into previous day close 3) Opening 30 min range 1573-1584.50. Trade was to short to counter the breakout of this range. Posted by Picasa

NQ daily chart

Thursday, October 06, 2005

20051005 1) EMA levels 1617 1615.50 1610 2) Strong trade into previous day close 3) Opening 30 min range 1603.50-1607.50. Trade was to short the downside breakout. T1 and T2 hit. Posted by Picasa

NQ daily chart

Monday, October 03, 2005

20051003 1) EMA levels 1608 1605 1600 2) Consolidation trade into previous day close 3) Opening 30 min range 1614.50-1625. No trade with the big range and no breakout of the range. Posted by Picasa

NQ daily chart