20050812 Daily chart. Possible that today was an ID (Inside Day) setting up a breakout swing trade either up or down.

 NQ daily chart
posted by emacro @ 9:31 PM
0 comments
![]()
![]()
Cronicle of trading in NQ 30 min breakout system, popularised by A Zuckerman of Realitytrader.com, WoodiesCCIClub patterns provide entries. Charts generated by Medved Quotetracker (www.quotetracker.com) Disclaimer: Nothing on this page constituutes advice to buy or sell financial instruments. The contents are for educational purposes only and are a personal journal.
20050812 Daily chart. Possible that today was an ID (Inside Day) setting up a breakout swing trade either up or down.
NQ daily chart
posted by emacro @ 9:31 PM
0 comments
![]()
![]()
20050811 EMA levels 1602.50 1604.50 1607 2) Consolidation trade into previous day closing 3) Opening 30 min range 1591-1597.50. Trade was to long the upside breakout with bth T1 and T2 hit.
 NQ daily chart
posted by emacro @ 8:08 PM
0 comments
![]()
![]()
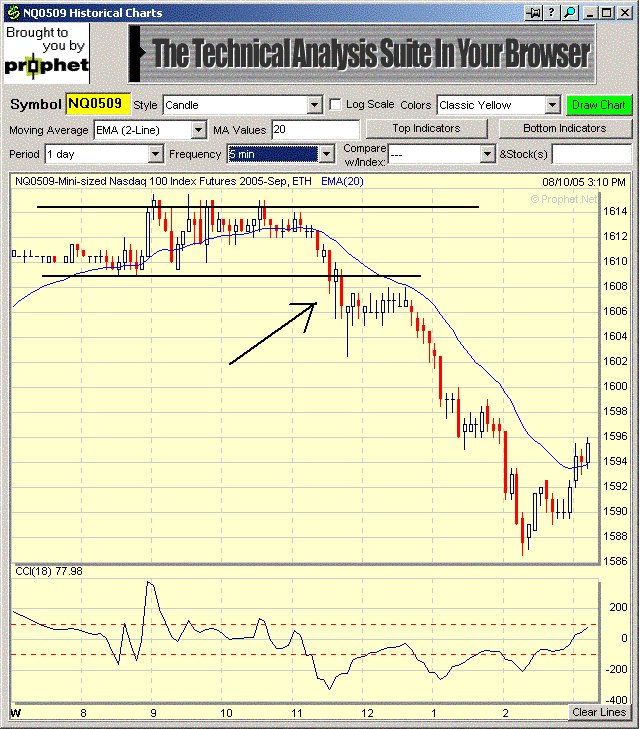
20050810 EMA levels 1606 1605.50 1606.50 2) Consolidation trade into previou closing 3) Opening 30 min range 1609-1614.50. First upside breakout trade stopped out. 2nd short trade on downside (arrow) T1 and T2 hit.
 NQ daily chart
posted by emacro @ 1:03 AM
0 comments
![]()
![]()
posted by emacro @ 11:15 AM
0 comments
![]()
![]()
20050808 1) EMA levels 1611 1614.50 1616.50 2) Consolidaiton trade into close previous day 3) Opening 30 min range 1606-1611.50. Trade #1 (first arrow) long the breakout to the upside stopped out. Trade #2 short downside breakout took some heat, but eventually hit both T1 and T2.
 NQ daily chart
posted by emacro @ 6:19 AM
0 comments
![]()
![]()