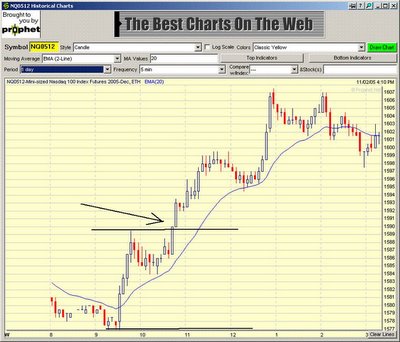
 20051102 1) EMA levels 1578 1581.50 1583 2) Consolidation trade into previous day close 3) Opening 30 min range 1577-1589.50. With 2 of the 3 elements of the setup present and the top of the range coinciding with the Inside Day high yesterday, trade was to long the upside breakout, T1 and T2 met.
  NQ daily chart


