Saturday, July 16, 2005


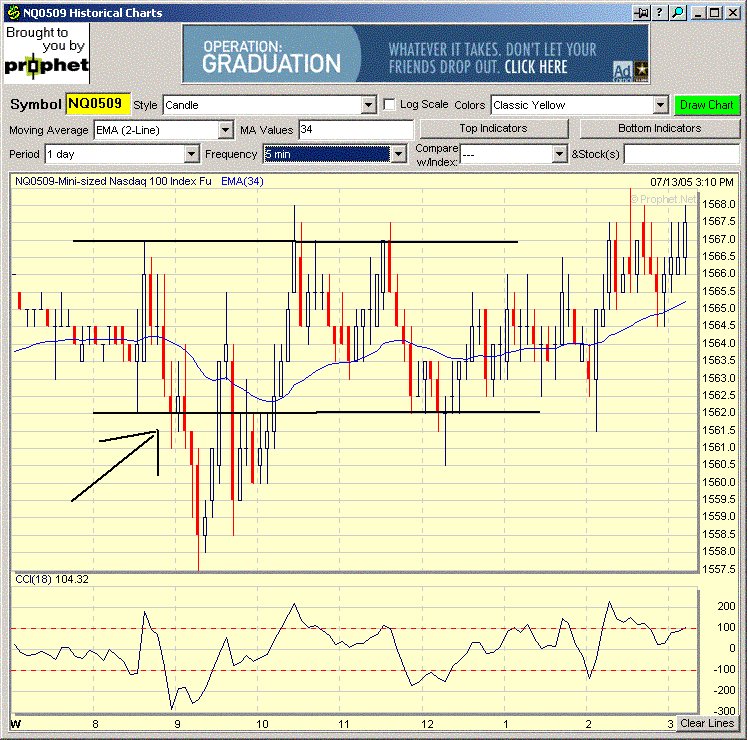
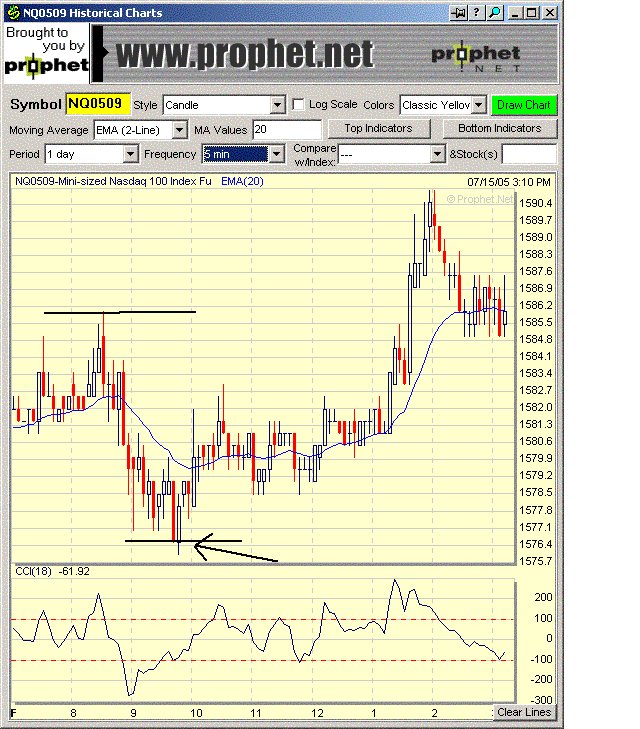
20050714 1) EMA 15=1580 30=1577 60=1571.50 2) Strong close trade in last 1 1/2 to 2 hour of previous day 3) Opening 30 min range 1577 -1586 about 9 NQ points. Decided to take the counter the breakout trade, which was a long around 1578, denoted by the arrow. Target of half the previous move was met.
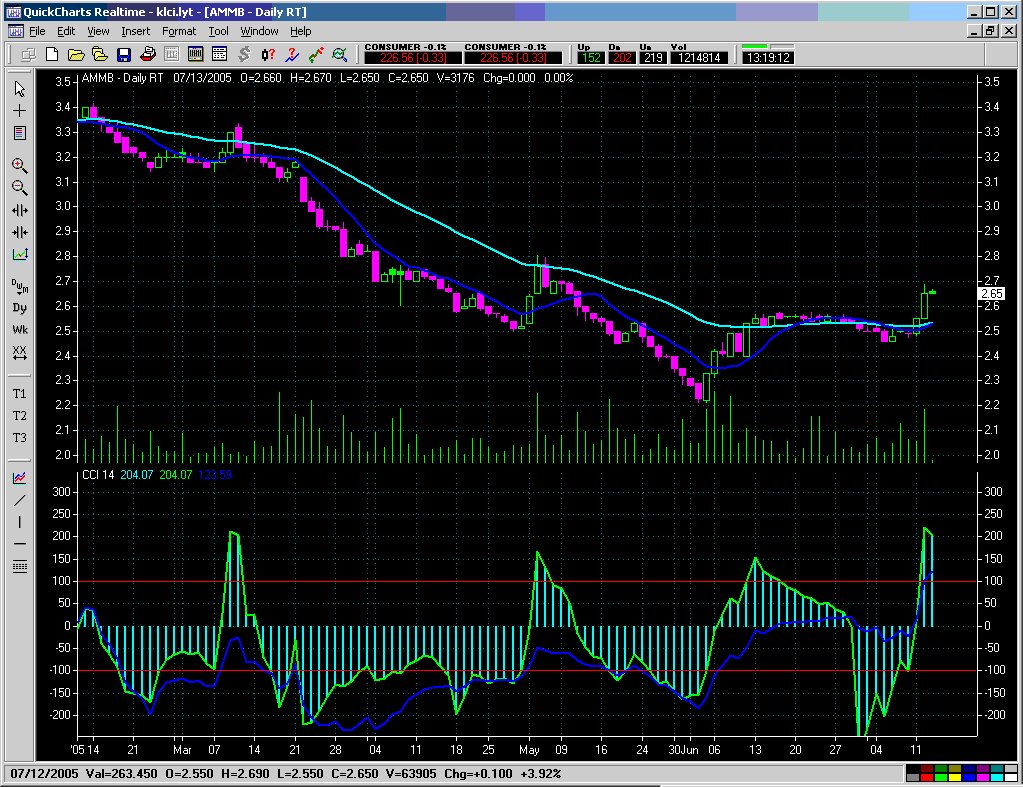
 Posted by Picasa

NQ daily chart


20050715 Daily NQ chart. Has been a strong week. Posted by Picasa

NQ daily chart

Thursday, July 14, 2005


20050714 1) EMA 15=1565 30=1563.50 60=1557.50 2) Consolidation trade into previous day's close 3) Opening 30 min range 1571-86 , 14 NQ points. This range was big, so was looking for a counter break out trade once it went to 1569 or 1588. Since this didn't come, no trade for today. Posted by Picasa

NQ daily chart

Wednesday, July 13, 2005


20050713 1) EMA 15=1559 30=1553 60=1543 2) Trade previous day was consolidation 3) First 30 min range 1562-67. Trade breakout on downside, but I did not take it because of moving avg support in the way. Posted by Picasa

NQ daily chart


20050712 Laggard blue chip AMMB coming back to life. Posted by Picasa

NQ daily chart


2005072 1) EMA 15=1547 30=1541 60=1532. 2) Consolidation trade the da before 3) Rnge 1553-1558 5 NQ pts. Looked for breakout trade, first arrow denoted trade short, although the mov avg was in the way. Trade failed. 2nd arrow shows long trade n upside which also failed. The real breakout came later. This is an example of rangebound trade in narrow range, not condusive to this system. Posted by Picasa

NQ daily chart

Monday, July 11, 2005


20050711 Op 30 min range 1544-48.5, 4.5 NQ points. No mov avg in the way of upside break out. Trade long at 1549, both targets hit. Posted by Picasa

NQ daily chart


20050711 1)EMA 15=1532.50 30=1527 60=1523 2) Strong close going into last Friday closing 3) Look for the opening 30 min range to complete the picture, but odds look like favoring the counter the break setup. Posted by Picasa

NQ daily chart