
posted by emacro @ 9:30 PM
0 comments
![]()
![]()
NQ Nasdaq 100 Futures Trading
Cronicle of trading in NQ 30 min breakout system, popularised by A Zuckerman of Realitytrader.com, WoodiesCCIClub patterns provide entries. Charts generated by Medved Quotetracker (www.quotetracker.com) Disclaimer: Nothing on this page constituutes advice to buy or sell financial instruments. The contents are for educational purposes only and are a personal journal.
Friday, August 26, 2005

20050826 1) EMA levels 1570 1572 1574.50 2) Consolidation trade into previous day close 3) Opening 30 min range 1561-1567. Trade was to short the downside breakout, but weak momentum meant did not reach T1 or T2.
 NQ daily chart
posted by emacro @ 8:50 PM
0 comments
![]()
![]()
Wednesday, August 24, 2005
20050824 1) EMA levels 1576.50 1577 1579 2) Strong close into previous day close 3) Opening 30 min range 1568-1573. Trade was to long the upside breakout, but with the moving averages in the way, pass on the trade, which did turn out to be a good one.
 NQ daily chart
posted by emacro @ 7:55 PM
0 comments
![]()
![]()
Tuesday, August 23, 2005
20050823 1) EMA levels 1578.50 1581.50 1581.50 2) Strong trade into the previous day closing 3) Opening 30 min range 1575.50-1583. Trade was to wait for a 2 NQ pt break out, cuntering with a long trade with stop at low, stopped out.
 NQ daily chart
posted by emacro @ 7:24 PM
0 comments
![]()
![]()
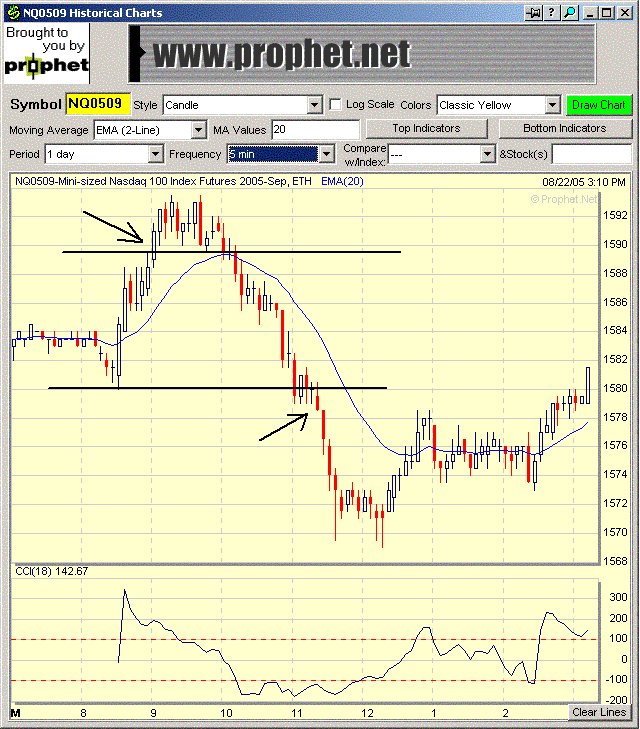
Monday, August 22, 2005
20050822 1) EMA levels 1580.50 1581 1582 2) Consolidation trade into previous day's close 3) 2 trades, first upside breakout without reaching the targets, 2nd downside break had bit more momentum, almost to T1. Mainl due to the 9 pt range.
 NQ daily chart
posted by emacro @ 7:47 PM
0 comments
![]()
![]()
Sponsors
- 20110624 HSI futures 21 tick giant wolfe wave.... ...
- 20110623 HSI futures 21 tick wolfe wave short toda...
- 20110615 Exit at 1274.75, a relatively smooth long...
- 20110615 ES futures 5 min wave long trade..
- 20110613 HSI futures wolfe wave buy turned out to ...
- 20110613 Long trigger on HSI futures wolfe wave...
- "I can give you the best rules in the world and t...
- 20110610 ES futures 2 min, buy wolfe wave...
- 20110610 HSI futures, a skewed wolfe wave... but i...
- 20050213
- 20050220
- 20050227
- 20050306
- 20050410
- 20050612
- 20050619
- 20050626
- 20050703
- 20050710
- 20050717
- 20050724
- 20050731
- 20050807
- 20050814
- 20050821
- 20050828
- 20050904
- 20050911
- 20050918
- 20050925
- 20051002
- 20051009
- 20051016
- 20051023
- 20051030
- 20051106
- 20051113
- 20051120
- 20051127
- 20051204
- 20051211
- 20051218
- 20051225
- 20060101
- 20060108
- 20060115
- 20060122
- 20060129
- 20060205
- 20060212
- 20060219
- 20060226
- 20060305
- 20060312
- 20060319
- 20060326
- 20060402
- 20060409
- 20060416
- 20060423
- 20060430
- 20060507
- 20060514
- 20060521
- 20060528
- 20060604
- 20060611
- 20060618
- 20060625
- 20060702
- 20060709
- 20060716
- 20060723
- 20060730
- 20060806
- 20060813
- 20060820
- 20060827
- 20060903
- 20060910
- 20060917
- 20060924
- 20061001
- 20061008
- 20061015
- 20061022
- 20061029
- 20061105
- 20061112
- 20061119
- 20061126
- 20061203
- 20061210
- 20061217
- 20061231
- 20070318
- 20070513
- 20070617
- 20070819
- 20071125
- 20071202
- 20071209
- 20071216
- 20071223
- 20071230
- 20080106
- 20080113
- 20080120
- 20080127
- 20080323
- 20081005
- 20081012
- 20081026
- 20090726
- 20090809
- 20090816
- 20090823
- 20090830
- 20090906
- 20090913
- 20090920
- 20090927
- 20091004
- 20091011
- 20091018
- 20091025
- 20091101
- 20091108
- 20091115
- 20091122
- 20091129
- 20091206
- 20091213
- 20091227
- 20100103
- 20100110
- 20100207
- 20100314
- 20100404
- 20100411
- 20100418
- 20100502
- 20100509
- 20100516
- 20100606
- 20100620
- 20100718
- 20100725
- 20100808
- 20100926
- 20101010
- 20101024
- 20101114
- 20101121
- 20110116
- 20110213
- 20110320
- 20110327
- 20110403
- 20110410
- 20110417
- 20110508
- 20110515
- 20110522
- 20110529
- 20110605
- 20110612
- 20110619
- Current Posts
Advertise here
1 year text link
placement USD80
email:emacro88@gmail.com
Links
Previous Posts
Archives

Syndicate this site


