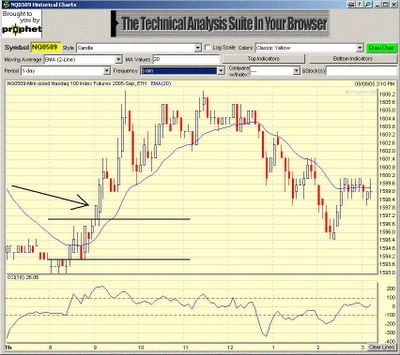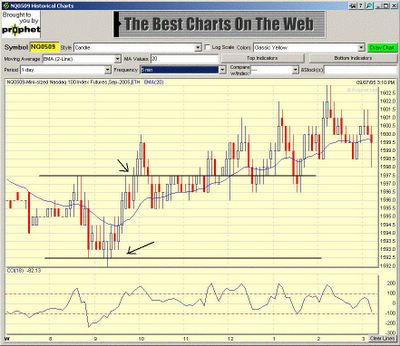
20050909 1) EMA levels 1513 1511 1507 2) Consolidation trade going into previous day close 3) Opening 30 min range 1512-1514. No trade, with opening range too small.
 NQ daily chart
Cronicle of trading in NQ 30 min breakout system, popularised by A Zuckerman of Realitytrader.com, WoodiesCCIClub patterns provide entries. Charts generated by Medved Quotetracker (www.quotetracker.com) Disclaimer: Nothing on this page constituutes advice to buy or sell financial instruments. The contents are for educational purposes only and are a personal journal.

 NQ daily chart

 NQ daily chart

 NQ daily chart

 NQ daily chart
For those of you regular visitors, I am thinking of putting the trade 'advice' on www.collective2.com, so that the info can be more timely. But catch is that you'd have to subscribe to the service and am thinking to charge US30 per trade, but ONLY if the trade turned out to be profitable.