Friday, September 30, 2005

20050930 1) EMA levels 1584 1590.50 1588 2) Consolidation trade into previoous day close 3) Opening 30 min range 1598.50-1605. Trade was to long the upside breakout, T1 hit.
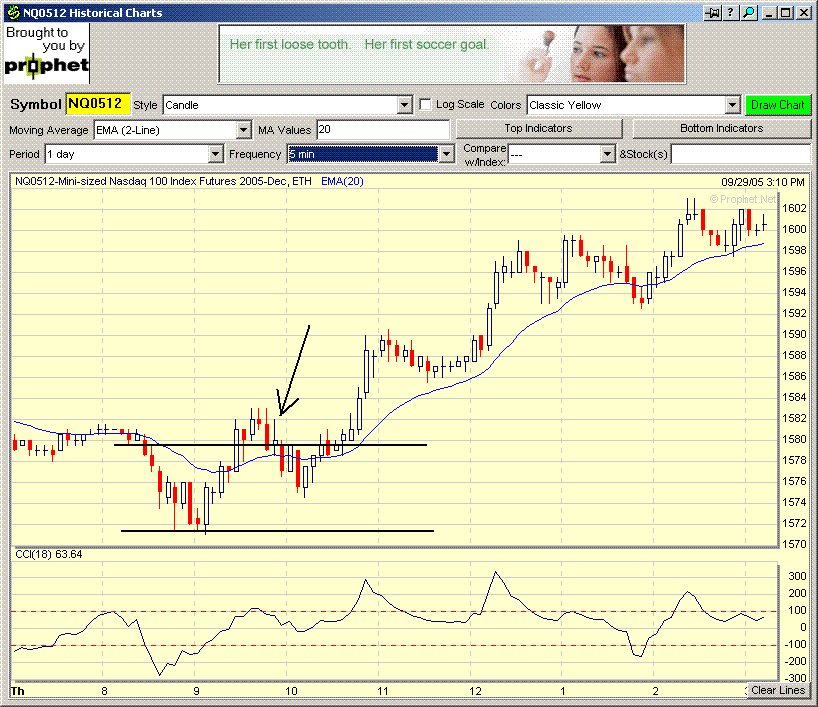
 Posted by Picasa

NQ daily chart


20050929 1) EMA levels 1582.50 1583 1583 2) Strong trade into previous day close 3) Opening 30 min range 1571.50-1579. Trade was to short to counter the breakout. Was in favour briefly, before stopped out. Posted by Picasa

NQ daily chart

Thursday, September 29, 2005


20050929 1) EMA levels 1583 1583.50 1583.50 2) Strong trade into previous day close 3) Opening 30 min range 1584.50-1588.50. Trade was to long the upside breakout, just failed to reach T1, stopped out of the position. Posted by Picasa

NQ daily chart

Wednesday, September 28, 2005


20050927 1) EMA levels 1584 1585 1584.50 2) Strong trade into previous day closing 3) Opening 30 min range 1584-1588.50. Trade was to short the downside breakout, which after some difficulty reached T1 and T2. Posted by Picasa

NQ daily chart