Saturday, July 02, 2005


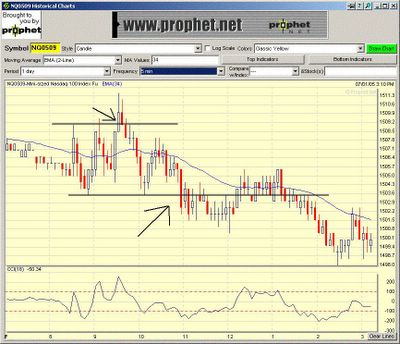
20050701 Op 30 min range 1503.5-1509, 5.5 NQ points, mov avg were all above 1509, trade for last 1.5 hours was strong close the previous day. Upside breakout trade was not taken because of the mov avg resistance above. Downside break later was the short trade for the system, with 2 elements (of the 3 required) present: small opening 30 min range and no mov avg in the way. Posted by Picasa

NQ daily chart

Thursday, June 30, 2005

20050630 Daily chart at support. Posted by Picasa

NQ daily chart

20050630 Op 30 min range 1514-1520. Shot on break below lower channel around 1513.5, both T1 and T2 hit, but Fed initial updraft reaction almost took out the stop. Posted by Picasa

NQ daily chart

20050630
20 ema 15 min=1514 min=1514.0 min=1515
Last 1.5 hours trade wss consolidation. Again, looking for the first 30 min bar range to be less than 10 NQ points for the 3rd element of the setup for breakout, else counter trade the breakut. Posted by Hello

NQ daily chart

Wednesday, June 29, 2005

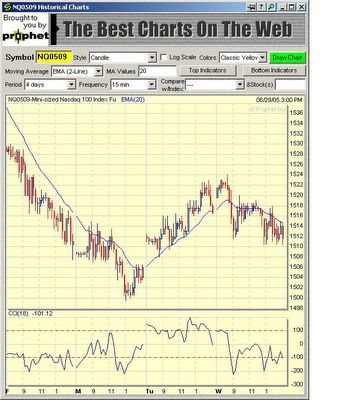
20050629 Op 30 min range 1514-1524 10 NQ pts. Tuuch and go as to go with breakout of range or counter trend trade. Decision was to stay sidelined with no trade. Posted by Hello

NQ daily chart

20050629
20 ema 15 min=1517 30 min=1515 60 min=1515
Last 1.5 hours trade wss consolidation

Once again looking for the 3rd element of the opening 30 min range to be greater or less than 10-12NQ points If all 3 elements present (bar not to big, no mov avg in the way, consolidation trade the day before) look for breakut trade with targets T1=1Xop 30 min range T2=1.5X op 30 min bar stop=other side of 30 min bar Else look for counter trend trade against the breakout.

NQ daily chart

Tuesday, June 28, 2005

20050629 Op 30 min range 1508-16, 8 NQ points coupled with consolidating trade the day before meant looking or breakout of range, which came after 10. But with moving avg in the way, was not easy going, took some heat and struggled to reach target. Posted by Hello

NQ daily chart

20050628
20 ema 15 min=1505 30 min=1509 60 min=1514
Last 1.5 hours trade wss consolidation

Look for op 30 min bar <>12 NQ pts, look for breakout at least 2 NQ points then trade reversal signal. Stop 1 or 2 ticks above/below high/low, profit target half of the move to the high/low.

NQ daily chart

Monday, June 27, 2005

20050627 Op 30 min range 1507.5-1515, 7.5 NQ points which is less than the 12 NQ required for the counter breakout trade, so the short on breakdown of the bottom range was taken. Did reach initia target of 1X the op range, but not quite the 1.5X the op range 2nd target.  Posted by Hello

NQ daily chart

20050627
20 ema 15 min=1514.50 30 min=1521.00 60 min=1526.50
Last 1.5 hours trade wss strong close pattern.

Would be looking for op 30 min range greter than 12 pts t counter any breakout, otherwise ook for breakout and go with it, if the mov avg are not in the way. Note the mov avg re wide apart, could be a sign of strong trend in the market.

NQ daily chart