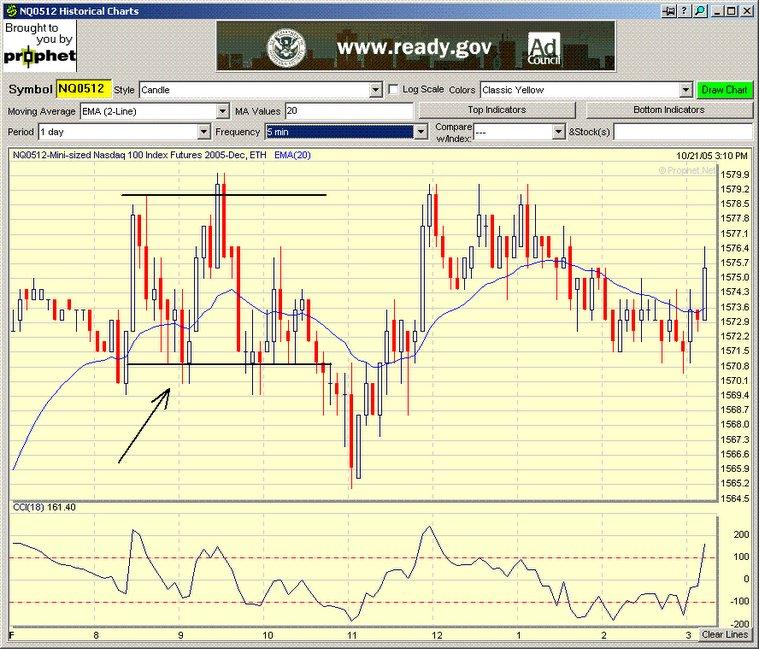
 20051021 1) EMA levels 1569 1568 1564.50 2) Consolidation trade into previous day's close 3) Opening 30 min range 1571-1579. Trade was to short the downside breakout, stopped out.
  NQ daily chart
posted by emacro @ 9:07 PM
0 comments
![]()
![]()


