posted by emacro @ 10:50 PM
0 comments
![]()
![]()
NQ Nasdaq 100 Futures Trading
Cronicle of trading in NQ 30 min breakout system, popularised by A Zuckerman of Realitytrader.com, WoodiesCCIClub patterns provide entries. Charts generated by Medved Quotetracker (www.quotetracker.com) Disclaimer: Nothing on this page constituutes advice to buy or sell financial instruments. The contents are for educational purposes only and are a personal journal.
Friday, July 22, 2005
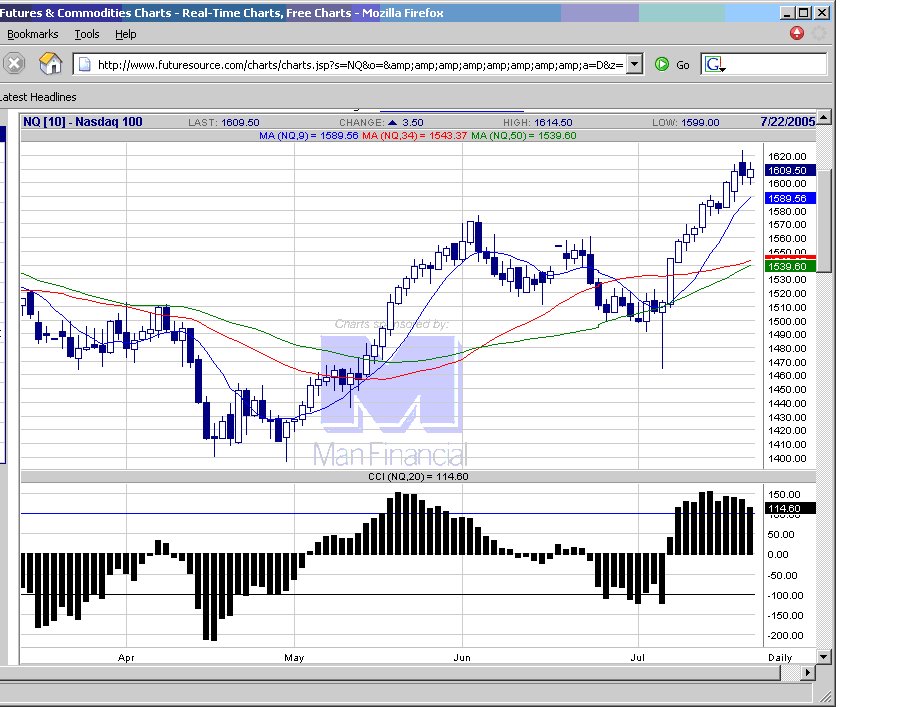
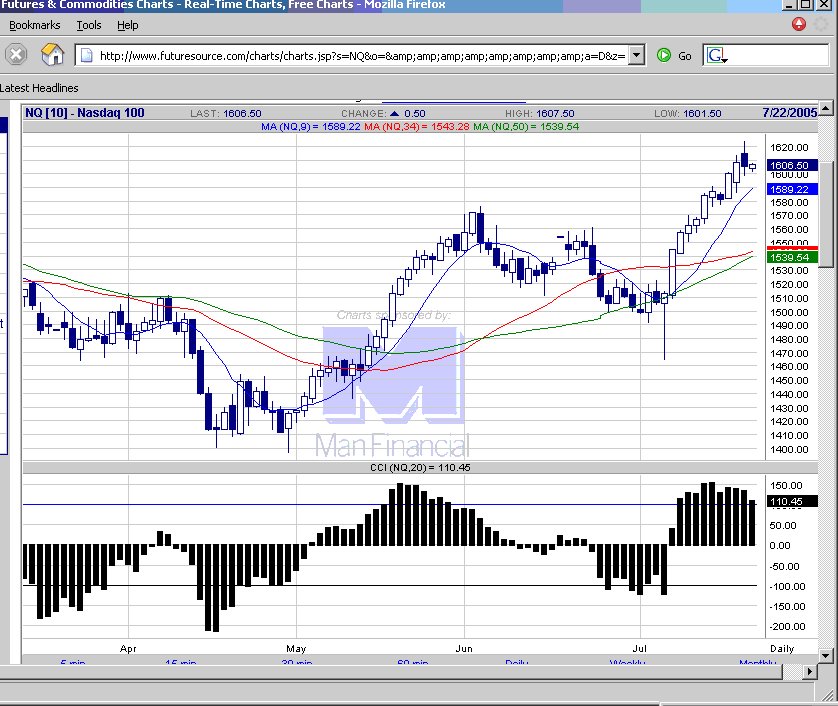
20050722 1) Mov avg at 1608 1604.5 1597.5 2) Strong close trade 3) Range 1608 to 1614.5. Trade counter the break on the doji andle depicted in the arrow, proper profit and stop order management determines p&l.

 NQ daily chart
posted by emacro @ 9:18 PM
0 comments
![]()
![]()
Thursday, July 21, 2005
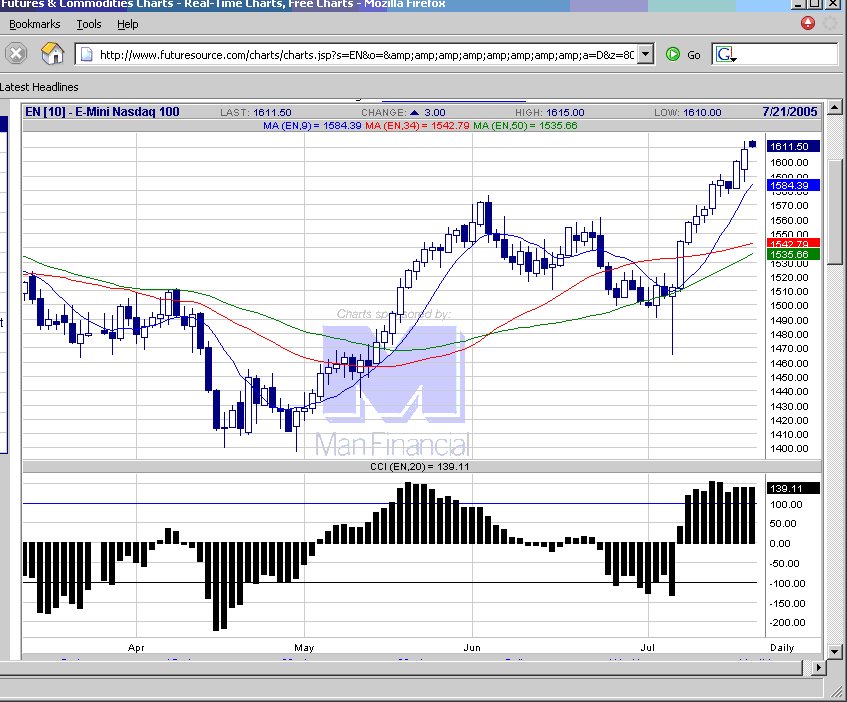
20050721 Two breakout trades, but not much follow through, the irst one because o the moving average levels 1602 1599 1598 in the way.
 NQ daily chart
posted by emacro @ 11:26 PM
0 comments
![]()
![]()
Wednesday, July 20, 2005
posted by emacro @ 8:19 PM
0 comments
![]()
![]()
Tuesday, July 19, 2005
20050719 1) EMA 15=1581.50 30=1580.50 60=1576 2) Consolidation trade for day before 3) Opening 30 min range 1584-1589. Trade was long on breaking upside, which reached both T1 and T2.
 NQ daily chart
posted by emacro @ 11:50 PM
0 comments
![]()
![]()
Monday, July 18, 2005
20050718 1) EMA 15=1583 30=1579 60=1571.50 2) Consolidating trade day before 3) opening 30 min range 1578.5-1583. Two breakout buy and sell respectively, both failed due to no lack of momentum, with trade in narrow range whole day.
 NQ daily chart
posted by emacro @ 8:17 PM
0 comments
![]()
![]()
20050718 An ID, inside day bar today. Watching for the breakout trade to be a strong one if the day high or low of today taken out.
 NQ daily chart
posted by emacro @ 8:08 PM
0 comments
![]()
![]()
Sponsors
- 20110624 HSI futures 21 tick giant wolfe wave.... ...
- 20110623 HSI futures 21 tick wolfe wave short toda...
- 20110615 Exit at 1274.75, a relatively smooth long...
- 20110615 ES futures 5 min wave long trade..
- 20110613 HSI futures wolfe wave buy turned out to ...
- 20110613 Long trigger on HSI futures wolfe wave...
- "I can give you the best rules in the world and t...
- 20110610 ES futures 2 min, buy wolfe wave...
- 20110610 HSI futures, a skewed wolfe wave... but i...
- 20050213
- 20050220
- 20050227
- 20050306
- 20050410
- 20050612
- 20050619
- 20050626
- 20050703
- 20050710
- 20050717
- 20050724
- 20050731
- 20050807
- 20050814
- 20050821
- 20050828
- 20050904
- 20050911
- 20050918
- 20050925
- 20051002
- 20051009
- 20051016
- 20051023
- 20051030
- 20051106
- 20051113
- 20051120
- 20051127
- 20051204
- 20051211
- 20051218
- 20051225
- 20060101
- 20060108
- 20060115
- 20060122
- 20060129
- 20060205
- 20060212
- 20060219
- 20060226
- 20060305
- 20060312
- 20060319
- 20060326
- 20060402
- 20060409
- 20060416
- 20060423
- 20060430
- 20060507
- 20060514
- 20060521
- 20060528
- 20060604
- 20060611
- 20060618
- 20060625
- 20060702
- 20060709
- 20060716
- 20060723
- 20060730
- 20060806
- 20060813
- 20060820
- 20060827
- 20060903
- 20060910
- 20060917
- 20060924
- 20061001
- 20061008
- 20061015
- 20061022
- 20061029
- 20061105
- 20061112
- 20061119
- 20061126
- 20061203
- 20061210
- 20061217
- 20061231
- 20070318
- 20070513
- 20070617
- 20070819
- 20071125
- 20071202
- 20071209
- 20071216
- 20071223
- 20071230
- 20080106
- 20080113
- 20080120
- 20080127
- 20080323
- 20081005
- 20081012
- 20081026
- 20090726
- 20090809
- 20090816
- 20090823
- 20090830
- 20090906
- 20090913
- 20090920
- 20090927
- 20091004
- 20091011
- 20091018
- 20091025
- 20091101
- 20091108
- 20091115
- 20091122
- 20091129
- 20091206
- 20091213
- 20091227
- 20100103
- 20100110
- 20100207
- 20100314
- 20100404
- 20100411
- 20100418
- 20100502
- 20100509
- 20100516
- 20100606
- 20100620
- 20100718
- 20100725
- 20100808
- 20100926
- 20101010
- 20101024
- 20101114
- 20101121
- 20110116
- 20110213
- 20110320
- 20110327
- 20110403
- 20110410
- 20110417
- 20110508
- 20110515
- 20110522
- 20110529
- 20110605
- 20110612
- 20110619
- Current Posts
Advertise here
1 year text link
placement USD80
email:emacro88@gmail.com
Links
Previous Posts
Archives

Syndicate this site


