
posted by emacro @ 10:25 PM
0 comments
![]()
![]()
NQ Nasdaq 100 Futures Trading
Cronicle of trading in NQ 30 min breakout system, popularised by A Zuckerman of Realitytrader.com, WoodiesCCIClub patterns provide entries. Charts generated by Medved Quotetracker (www.quotetracker.com) Disclaimer: Nothing on this page constituutes advice to buy or sell financial instruments. The contents are for educational purposes only and are a personal journal.
Friday, August 19, 2005
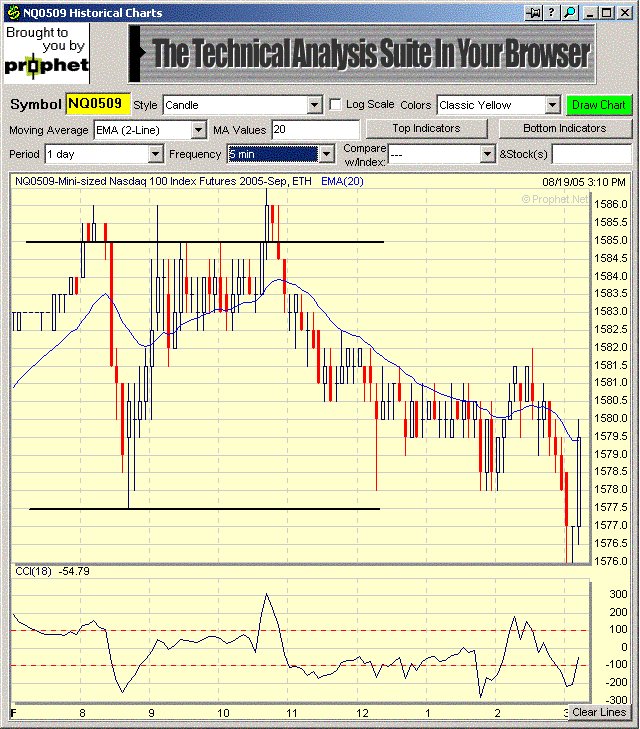
20050819 1) EMA levels 1581.50 1582 1583.50 2) Consolidation trade into previous day close 3) Opening 30 min range 1577-1581.50. NQ broke upside but no trade was taken because the moving averages were in the way. Downside break came near the close, precluding the short trade. NQ has been tight range for past two days, coiling the spring for a powerful breakout either side next week.

 NQ daily chart
posted by emacro @ 10:02 PM
0 comments
![]()
![]()
20050818 1) EMA levels 1588 1589 159.50 2) Strong trade into previous closing 3) Opening 30 min range 1577.5-1582. No trade as the upside breakout was limited by the moving averages and the narrow first 30 min range.
 NQ daily chart
posted by emacro @ 3:52 AM
0 comments
![]()
![]()
Thursday, August 18, 2005
20050817 1) EMA levels 1589.50 1592.50 1595 2) Strong trade into previous day's closing 3) Opening 30 min range 1580.50-1586. Was looking to counter the breakout trade, even though the range was only 5.50 NQ points. First one yieled profit, with the second stopped out.
 NQ daily chart
posted by emacro @ 1:50 AM
0 comments
![]()
![]()
Wednesday, August 17, 2005

posted by emacro @ 8:02 PM
0 comments
![]()
![]()
Tuesday, August 16, 2005
20050816 1) EMA levels 1602.50 1600 1600 2) Strong trade into previous close 3) Opening 30 min range 1595-1601.50. Trade was to short the bredak on the downside with both targets hig.
 NQ daily chart
posted by emacro @ 8:28 PM
0 comments
![]()
![]()
Monday, August 15, 2005
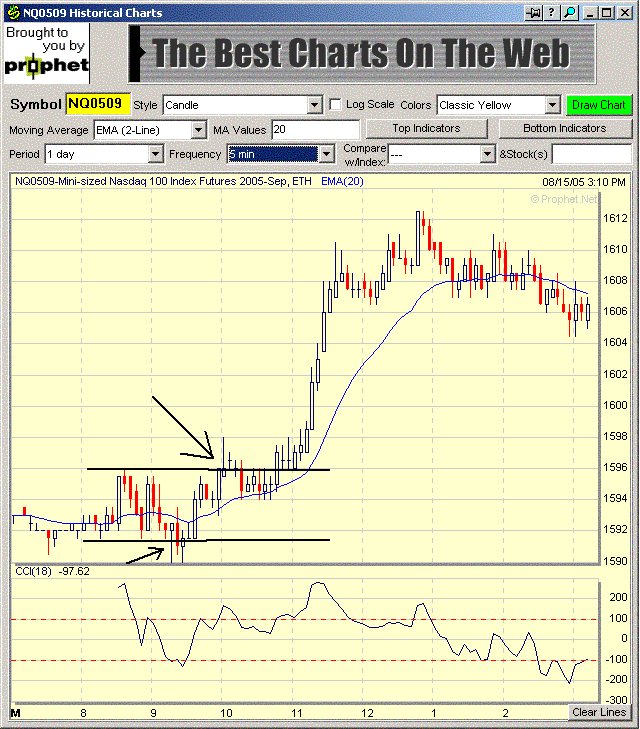
20050815 1) EMA levels 1592.50 1593 1595.50 2) Consolidation trade going into previous da close 3) Opening 30 min range 1591.50-1596. First trade short the downside break stpped out, with reverse long breakout trade hitting both targets.
 NQ daily chart
posted by emacro @ 7:51 PM
0 comments
![]()
![]()
Sponsors
- 20110624 HSI futures 21 tick giant wolfe wave.... ...
- 20110623 HSI futures 21 tick wolfe wave short toda...
- 20110615 Exit at 1274.75, a relatively smooth long...
- 20110615 ES futures 5 min wave long trade..
- 20110613 HSI futures wolfe wave buy turned out to ...
- 20110613 Long trigger on HSI futures wolfe wave...
- "I can give you the best rules in the world and t...
- 20110610 ES futures 2 min, buy wolfe wave...
- 20110610 HSI futures, a skewed wolfe wave... but i...
- 20050213
- 20050220
- 20050227
- 20050306
- 20050410
- 20050612
- 20050619
- 20050626
- 20050703
- 20050710
- 20050717
- 20050724
- 20050731
- 20050807
- 20050814
- 20050821
- 20050828
- 20050904
- 20050911
- 20050918
- 20050925
- 20051002
- 20051009
- 20051016
- 20051023
- 20051030
- 20051106
- 20051113
- 20051120
- 20051127
- 20051204
- 20051211
- 20051218
- 20051225
- 20060101
- 20060108
- 20060115
- 20060122
- 20060129
- 20060205
- 20060212
- 20060219
- 20060226
- 20060305
- 20060312
- 20060319
- 20060326
- 20060402
- 20060409
- 20060416
- 20060423
- 20060430
- 20060507
- 20060514
- 20060521
- 20060528
- 20060604
- 20060611
- 20060618
- 20060625
- 20060702
- 20060709
- 20060716
- 20060723
- 20060730
- 20060806
- 20060813
- 20060820
- 20060827
- 20060903
- 20060910
- 20060917
- 20060924
- 20061001
- 20061008
- 20061015
- 20061022
- 20061029
- 20061105
- 20061112
- 20061119
- 20061126
- 20061203
- 20061210
- 20061217
- 20061231
- 20070318
- 20070513
- 20070617
- 20070819
- 20071125
- 20071202
- 20071209
- 20071216
- 20071223
- 20071230
- 20080106
- 20080113
- 20080120
- 20080127
- 20080323
- 20081005
- 20081012
- 20081026
- 20090726
- 20090809
- 20090816
- 20090823
- 20090830
- 20090906
- 20090913
- 20090920
- 20090927
- 20091004
- 20091011
- 20091018
- 20091025
- 20091101
- 20091108
- 20091115
- 20091122
- 20091129
- 20091206
- 20091213
- 20091227
- 20100103
- 20100110
- 20100207
- 20100314
- 20100404
- 20100411
- 20100418
- 20100502
- 20100509
- 20100516
- 20100606
- 20100620
- 20100718
- 20100725
- 20100808
- 20100926
- 20101010
- 20101024
- 20101114
- 20101121
- 20110116
- 20110213
- 20110320
- 20110327
- 20110403
- 20110410
- 20110417
- 20110508
- 20110515
- 20110522
- 20110529
- 20110605
- 20110612
- 20110619
- Current Posts
Advertise here
1 year text link
placement USD80
email:emacro88@gmail.com
Links
Previous Posts
Archives

Syndicate this site


