Thursday, September 01, 2005


20050901 1) EMA levels 1574.50 1572 1751.50 2) Strong trade into previous day closing 3) Opening 30 min range 1582-1587. Trade was short the downside breakout, hit T1.
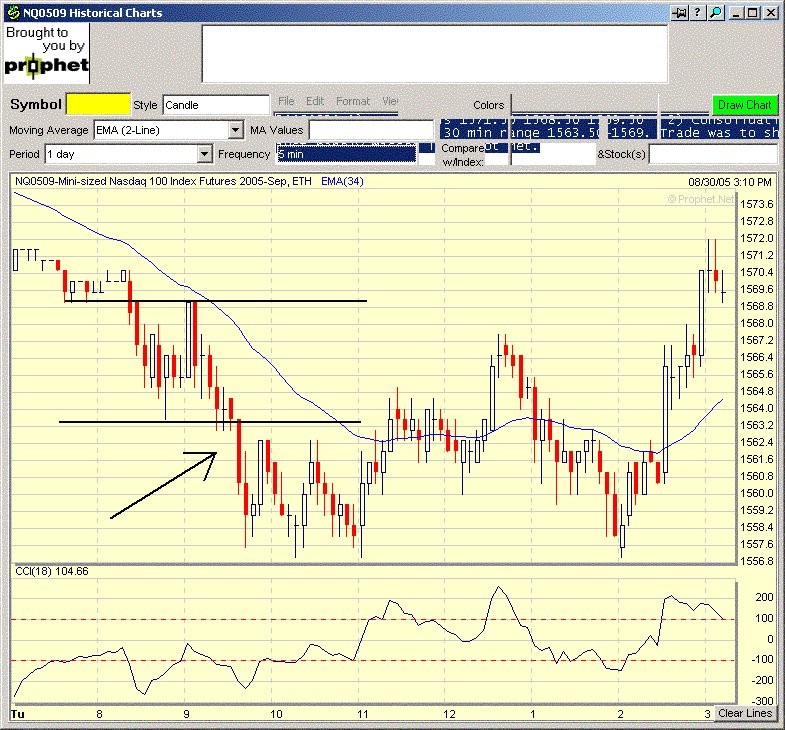
 Posted by Picasa

NQ daily chart

Wednesday, August 31, 2005


20050831 1) EMA levels 1564.50 1565 1566.50 2) Strong trade into previous day closing 3) Opening 30 min range 1565-1574 9 NQ points. Because of bigger range, trade was to counter the breakout, long on reversal bar after the downside break target of halfway of the previous move hit. Posted by Picasa

NQ daily chart

Tuesday, August 30, 2005


20050830 1) EMA levels 1571.50 1568.50 1569.50 2) Consolidation trade into previous day closing 3) Opening 30 min range 1563.50-1569. Trade was to short the downside breakout, just barely missed T1 T2 not met. Posted by Picasa

NQ daily chart

Monday, August 29, 2005

20050829 1) EMA levels 1564 1566 156950 2) Strong trade into previous day closing 3) Opening 30 min range 1554.50-1562. Trade was long the breakout on upside, with T1 hit and T2 eventually hit. Posted by Picasa

NQ daily chart