Saturday, July 09, 2005


20050708NQ Daily chart. CCI flips above zero, nice candlestick bar indicates buying, paves the way for more upside. Mov avg support at 1532, could be good level for swing trade on long side. Posted by Picasa

NQ daily chart


20050708 1) EMAs 15min=1508 30min=1507.50 60min=1506.50 2) Last 1 1/2 to 2 hours of previous day's trade was consolidation 3) Opening 30 min range was 1510-1516, 6 NQ points. First breakout ws to the downside given by the first arrow. This short trade turned out to be a loser, but the 2nd arrow was a good long trade on a stop and reverse of the short position. Posted by Picasa

NQ daily chart

Thursday, July 07, 2005


20050707 Op 30 min ange 1492-1503.50 which was greater than 10 NQ points. Looked for countre break trade which came on break down 1492, but not setup properly as the break down was not more than 2 NQ pts. Posted by Picasa

NQ daily chart

Wednesday, July 06, 2005


20050706 Trade was a break ut of the upside of the opening 30 min range 15095-1518.5. Turned out to be a loser, although the counter trend looked better in hindsight. But the elements were in place for the break out trade, with the exception of the daily chart. Normally after a strong trending day either way the markets goes into consolidation like it did today. Posted by Picasa

NQ daily chart


20050706 1)20 ems 15 min=1513 30 min=1511 60 min=1508.50 2) Last hr to 2 hr trade was consolidtion. Look for the 30 min opening range for the 3rd element to go with break of range or counter trade. Posted by Picasa

NQ daily chart

Tuesday, July 05, 2005


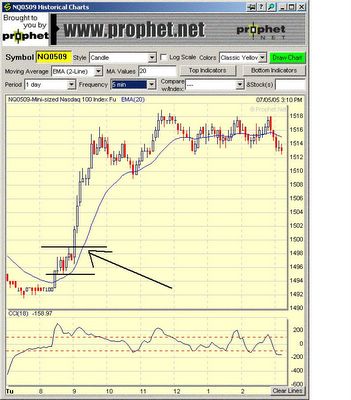
20050705 Op 30 mi range 1495-1499 Long taken on breakout on the upside with 2 elements of the 3 required for the setup. Posted by Picasa

NQ daily chart


20050705 Setup has the 20 ema 15 min=1502.5 30 min=1504.5 60 min=1503.5 with the last 1.5 to 2 hurs of trade on Friday being consolidative. So the openig 30 min bar toda will determine the third element of the trade setup, whether to go with the breakout or counter it. Posted by Picasa

NQ daily chart