Friday, July 29, 2005

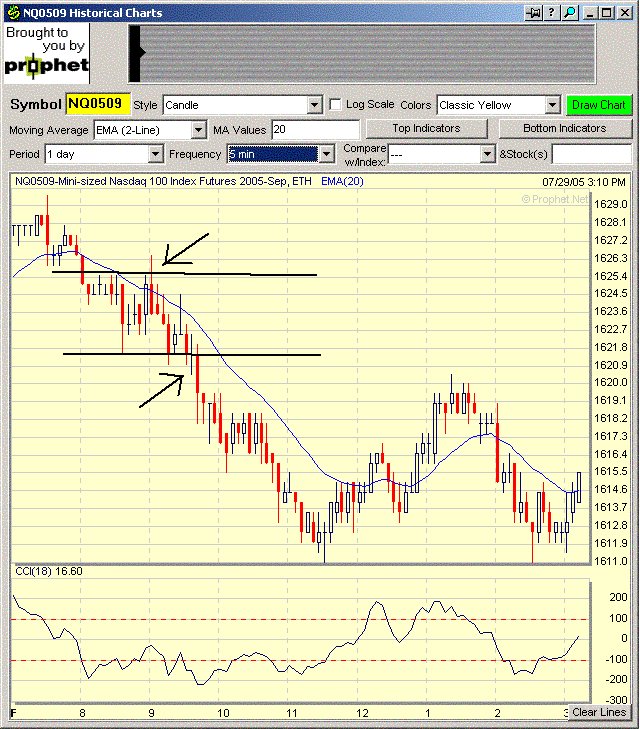
20050729 1) EMA levels 1624 1621.50 1618 2) Consolidation trade the previous day closing 3) Opening 30 min range 1524.50-1525.50 5 NQ pts. First upside breakout failed. 2nd break out on the downside hit both T1 and T2. Posted by Picasa

NQ daily chart

Thursday, July 28, 2005

20050728 1) EMA levesl 1611 1609 1607 2) consolidatin trade day before 3) Opening 30 min range 1616.5-1622. Two breakout trades, first one failed, 2nd one was ok, but did not reach targets T1 and T2. Posted by Picasa

NQ daily chart

Wednesday, July 27, 2005

20050727 1) EMA levels 1605.5 1605.0 1605.0 2) Strong closing trade 3) Opening 30 min range 1603-1608.50. Trade was to counter the downside breakdown of more than 2 NQ points. Target of half the previous move hit, although the market did continue up significantly in the afternoon. Posted by Picasa

NQ daily chart

Tuesday, July 26, 2005

20050726 1) Moving avg levels 1604.5 1605 1603 2) Strong close trade previus day 3) Op 30 min range 1603-1607. Trade was to counter the downside break because of the strong trade the last hour or so trade of the previous day and the moving avg levels in the way of the breakout. Posted by Picasa

NQ daily chart

20050725 1) Mov Avg levels 1606.5 1607 1605.5 2) Consolidation trade 3) Op 30 min range 1607.5-1612. First shot break out not taken because of the moving average levels in the way. 2nd long breakout signal was good, but still lacked follow thrugh to targets T1 or T2. Posted by Picasa

NQ daily chart